Why You Should Throw Your Scales Out During Perimenopause
The number on your scale is not telling you what is actually happening in your body and in perimenopause, that gap becomes clinically significant
Most of my patients arrive at the clinic having spent months sometimes years managing their health through a single metric: the number on the bathroom scale.
It goes up, they restrict. It goes down, they feel vindicated. It stops moving, they feel defeated.
Here is the problem: the scale measures one thing only: total gravitational mass. It cannot tell you whether that mass is muscle, fat, water, or bone. It cannot tell you where the fat is sitting, whether you're losing lean tissue, or whether your metabolic risk is worsening even as the number stays exactly the same.
In perimenopause, this gap between "the number" and "what's actually happening" becomes medically relevant. Understanding why and what we measure instead is one of the most important shifts I see patients make.
What the Scale Actually Measures
Your total body weight at any moment is the sum of: fat tissue, lean muscle mass, bone density, water (intracellular and extracellular), organ weight, and the contents of your gastrointestinal tract.
That is a lot of variables. On any given morning, your weight can fluctuate by 1–3kg depending on fluid retention, sodium intake the day before, where you are in your cycle, how much glycogen is stored in your muscles, and whether you've eaten breakfast.
None of that fluctuation tells you anything meaningful about your body composition or metabolic health.
What Perimenopause Actually Changes
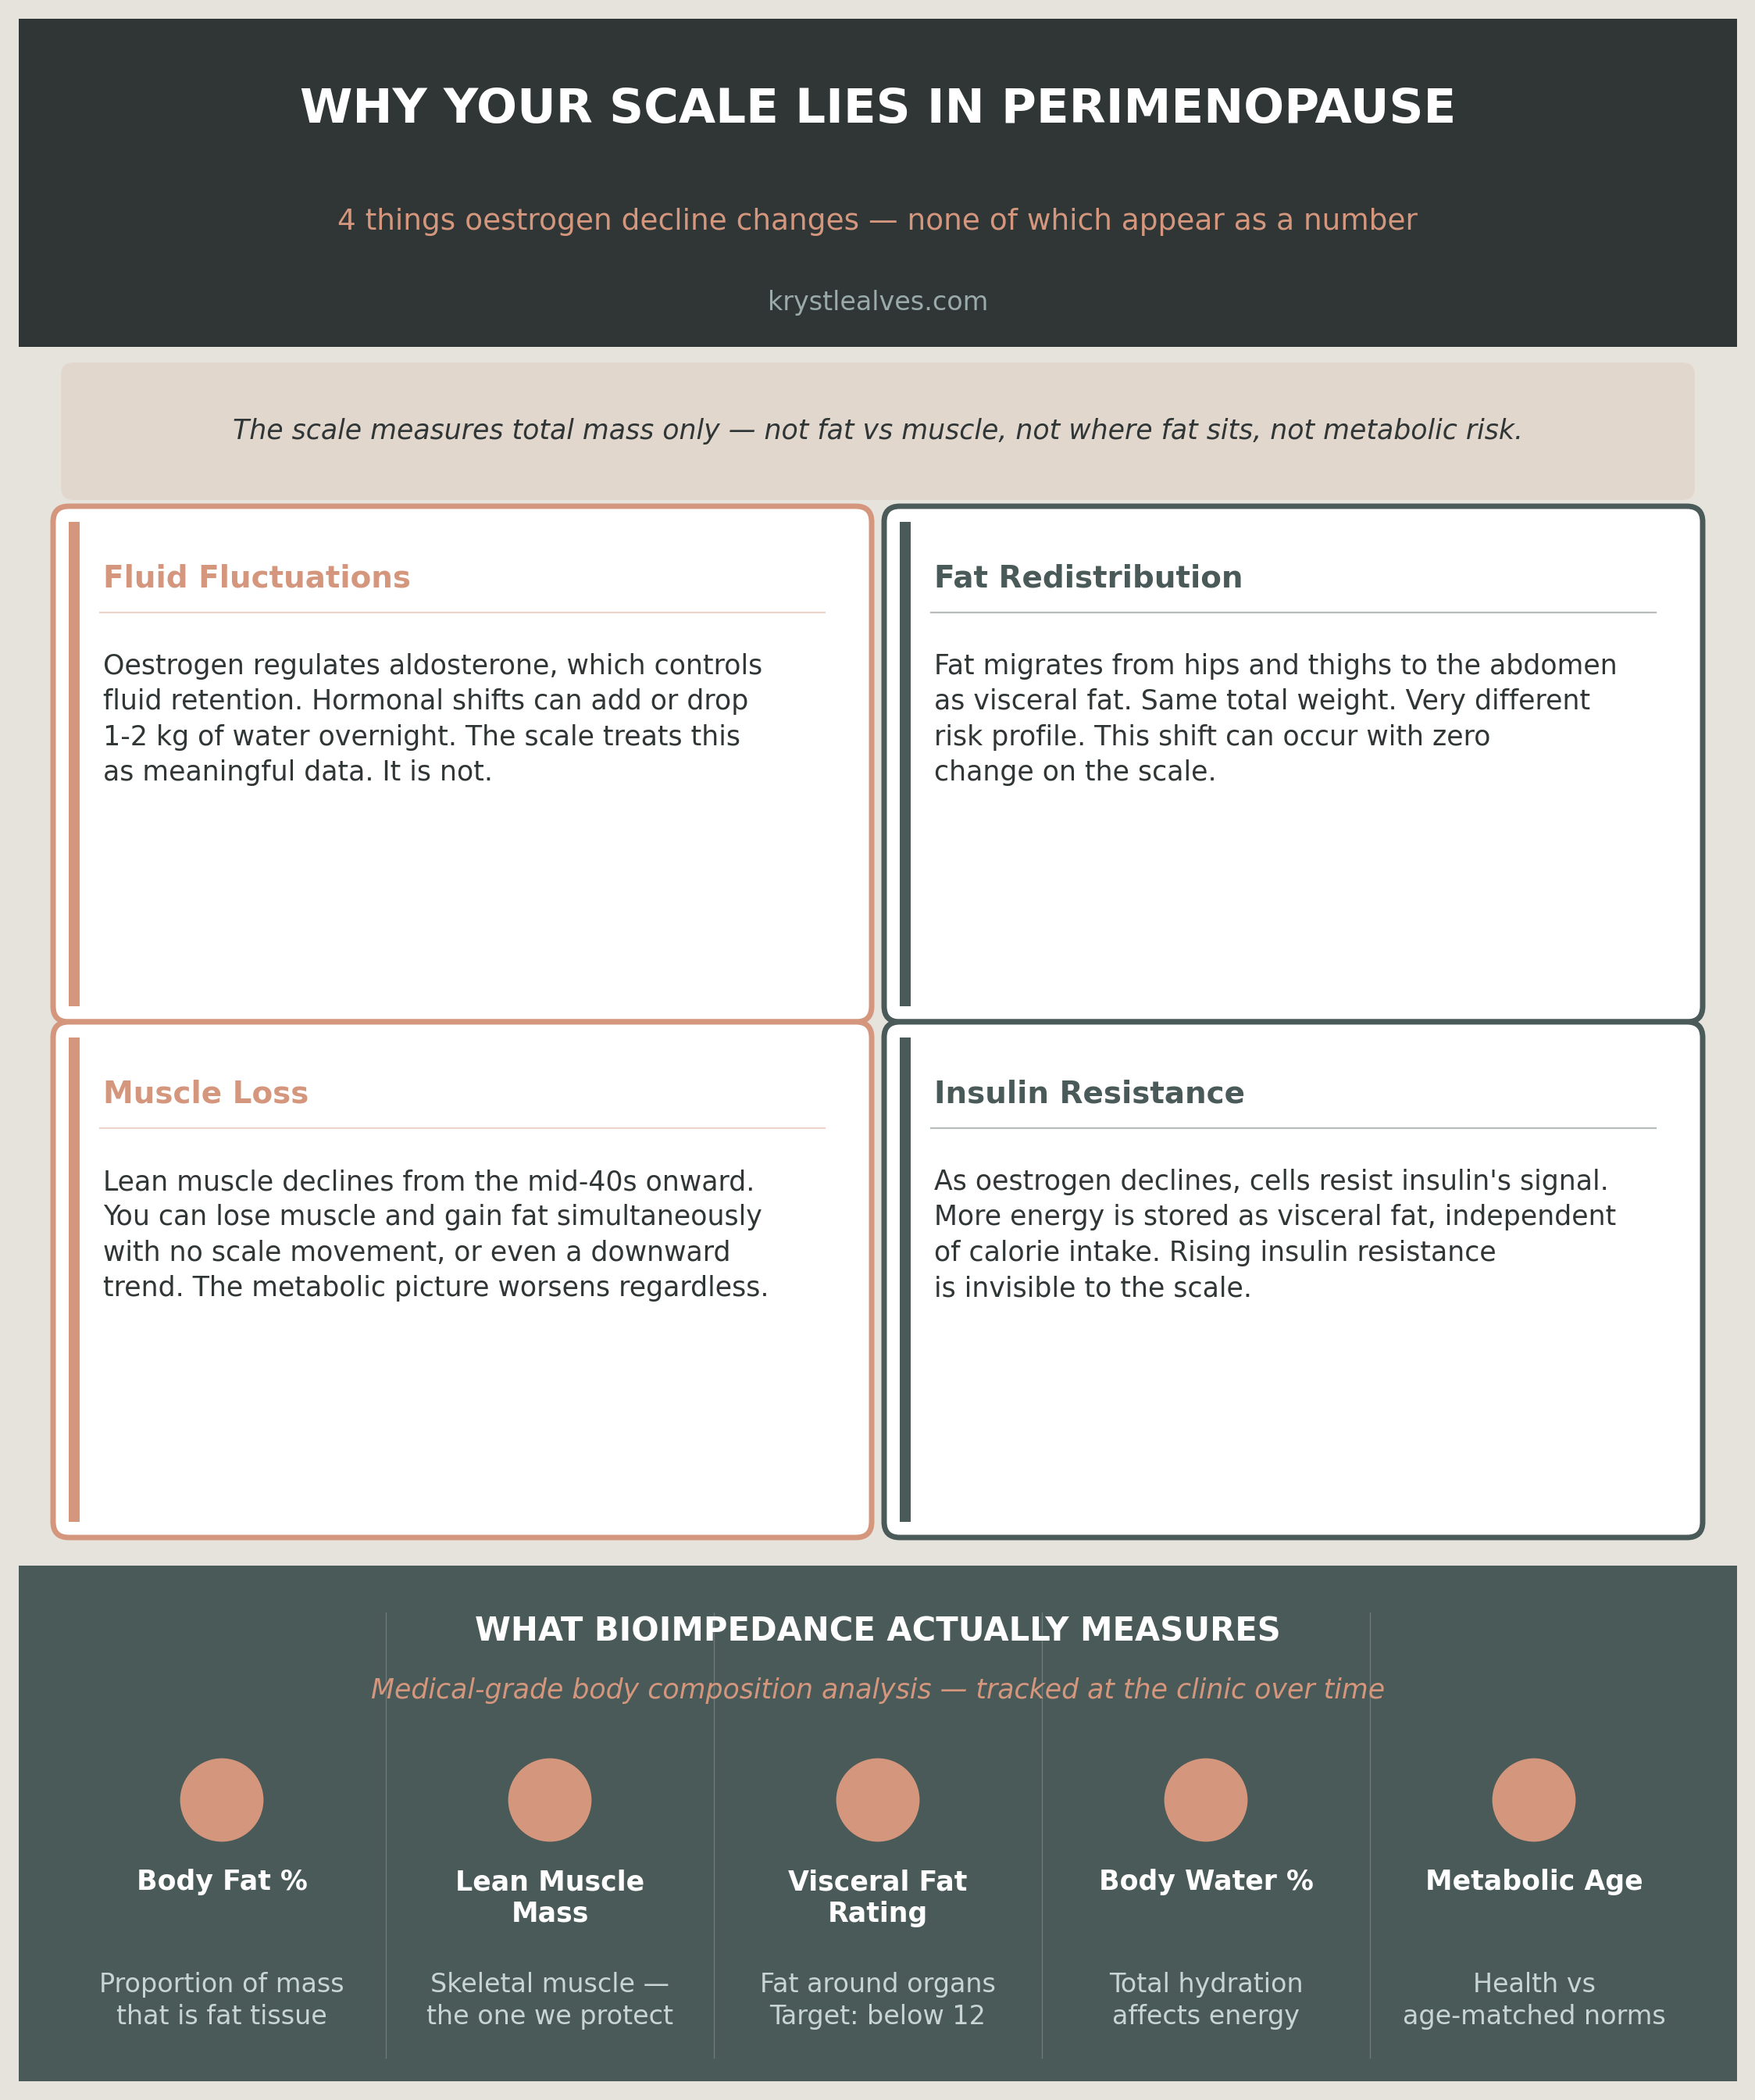
Oestrogen decline doesn't cause you to gain weight in a simple, linear way. It changes where fat is stored, how efficiently your body uses energy, and how your tissues respond to insulin. The scale captures none of this nuance.
Fluid regulation shifts. Oestrogen influences aldosterone the hormone that governs sodium and water retention. As levels fluctuate during the perimenopause transition, fluid retention patterns change unpredictably. A 1–2kg swing on the scale in either direction can reflect hormonal fluid shifts, not fat gain or loss.
Fat redistribution occurs independently of total weight. This is one of the most important and least understood changes of perimenopause. Fat that was historically stored subcutaneously around the hips, thighs, and buttocks begins migrating to the abdomen, specifically as visceral fat (the metabolically active fat stored around internal organs). A woman can maintain exactly the same total weight throughout the perimenopause transition while her body composition and metabolic risk profile shift substantially. The scale shows nothing. The body composition scan shows everything.
Lean muscle mass declines. From the mid-forties onward, sarcopenia the age-related loss of skeletal muscle accelerates, particularly without adequate protein and resistance training. Muscle is denser than fat. It is entirely possible to simultaneously lose lean muscle and gain fat while the scale stays flat or even drops because muscle is heavier. The number looks fine. The metabolic picture is worsening.
Insulin resistance increases. Oestrogen plays a direct role in insulin sensitivity. As circulating oestrogen levels decline during perimenopause, cells become progressively more resistant to insulin's signal. The pancreas compensates by producing more insulin. The result: more energy is directed into fat storage particularly visceral fat storage independent of calorie intake. Blood sugar fluctuations worsen, hunger and satiety signals dysregulate, and the risk of type 2 diabetes and cardiovascular disease climbs. Again none of this appears on the scale.
Why Insulin Resistance Is the Under-Discussed Driver
Insulin resistance in perimenopause is not a side note. It is one of the central metabolic changes of the transition, and it has downstream consequences throughout the body.
When cells are resistant to insulin, glucose stays elevated in the bloodstream longer. The pancreas overshoots on insulin to compensate. Elevated insulin is a fat-storage signal and in this hormonal environment, that storage preferentially accumulates as visceral fat.
The consequences extend beyond body composition. Chronically elevated insulin drives inflammation, disrupts lipid profiles, raises cardiovascular risk, and accelerates the progression toward type 2 diabetes. Addressing insulin resistance through targeted nutrition, resistance training, specific supplementation, and in some cases peptide support is a primary goal of any evidence-based perimenopause protocol. It is also why body composition monitoring matters: we need to know whether interventions are actually improving the underlying metabolic picture, not just moving the number on a scale.
The Problem With Visceral Fat
Not all fat carries the same metabolic risk. Subcutaneous fat the fat under the skin is largely metabolically inert. Visceral fat, stored deep within the abdominal cavity around organs including the liver, pancreas, and intestines, is not.
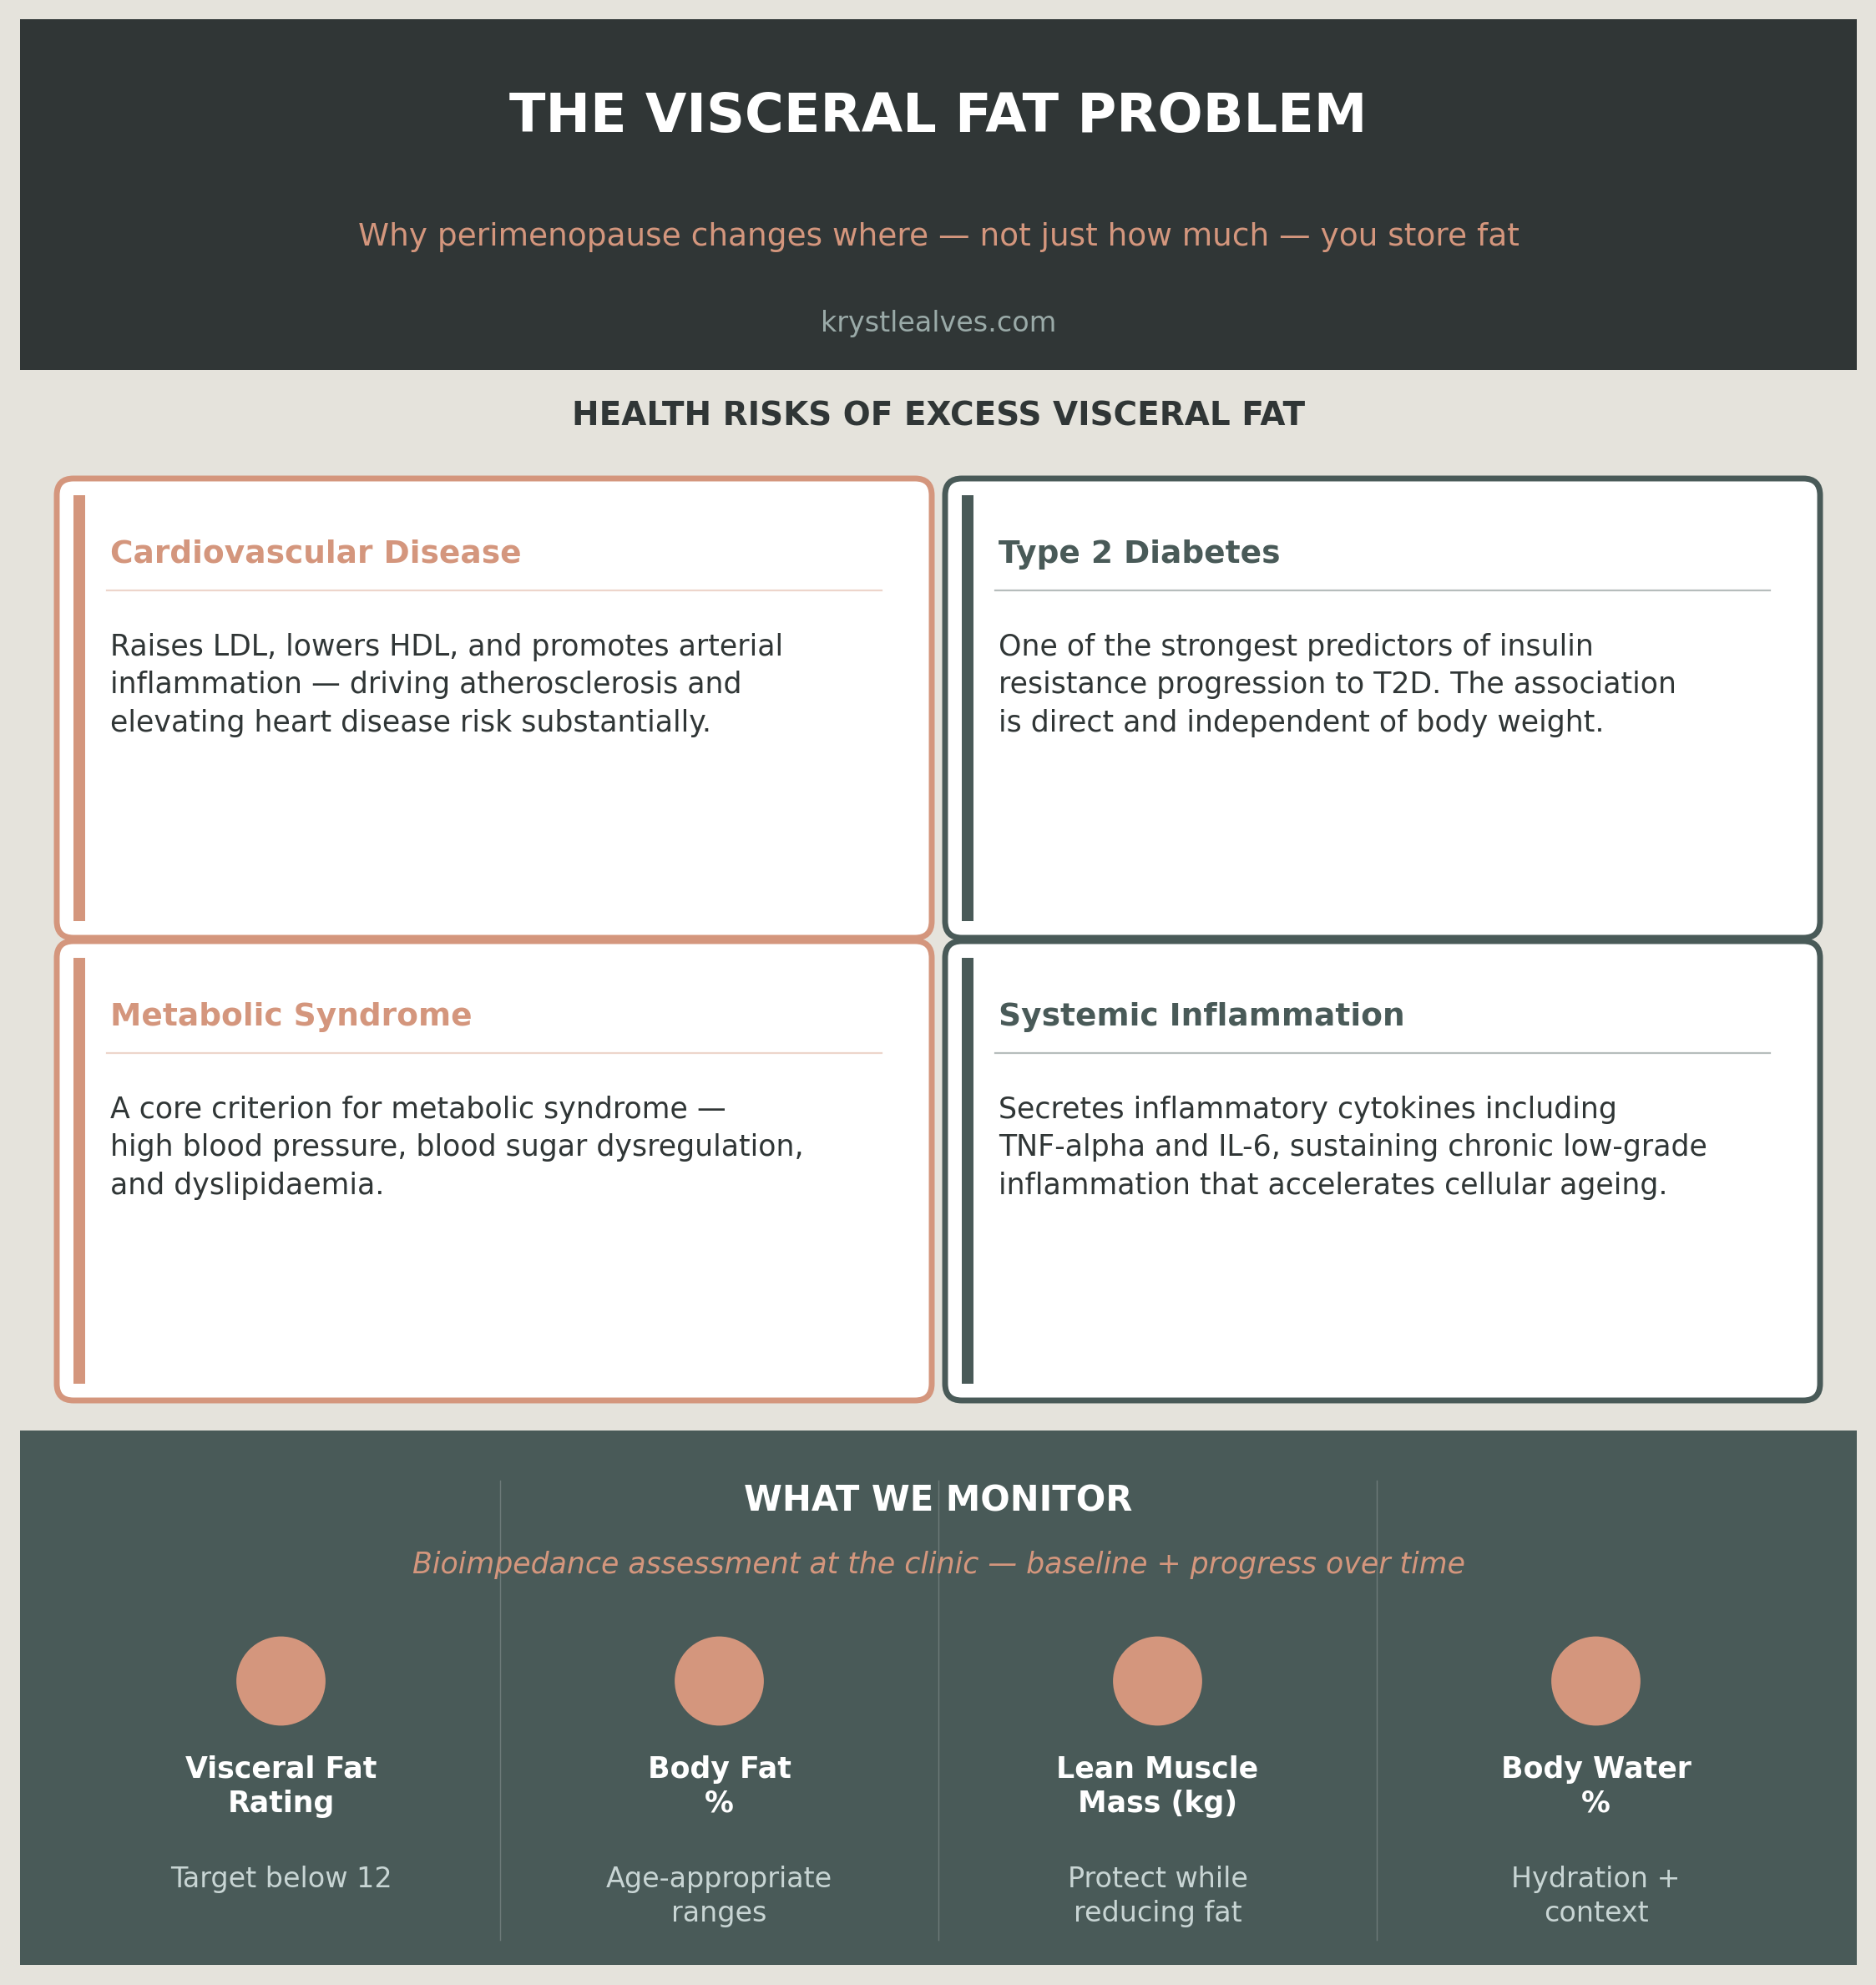
Visceral fat is metabolically active tissue. It releases a range of inflammatory cytokines, including TNF-alpha, IL-6, and adiponectin, that drive systemic inflammation, worsen insulin resistance, and impair liver function. The evidence linking excess visceral fat to cardiovascular disease, metabolic syndrome, type 2 diabetes, non-alcoholic fatty liver disease, and increased all-cause mortality is robust and consistent.
In perimenopause, the shift from subcutaneous to visceral fat distribution is one of the primary mechanisms by which cardiovascular and metabolic risk increases in women who previously had low risk profiles. This shift can and frequently does occur without any change in total body weight. A woman can have a BMI firmly in the "healthy" range while carrying clinically significant visceral fat.
The scale would tell her she is fine. Bioimpedance analysis would tell a different story.
Why BMI Doesn't Solve This Either
If the scale isn't the answer, surely body mass index, which accounts for height, gets us closer?
No. BMI is weight divided by height squared. It tells you how heavy you are relative to your stature. It does not measure body composition. It does not differentiate fat from muscle. It has no mechanism for distinguishing visceral from subcutaneous fat, and it cannot capture the redistribution that occurs in perimenopause.
Two people with identical BMIs can have entirely different body fat percentages, different visceral fat loads, and different metabolic risk profiles. BMI was developed as a population-level statistical tool in the nineteenth century it was never designed for individual clinical assessment, and using it as one is a known limitation that researchers have flagged for decades.
In perimenopause specifically, BMI becomes even less useful. As lean muscle mass declines and fat increases, body composition can worsen while BMI holds steady. The metric tells you less when you need it most.
What Bioimpedance Analysis Actually Measures
Bioimpedance analysis (BIA) works by passing a low-level electrical current through the body. Different tissues conduct electricity differently lean muscle (which contains water) conducts readily, while fat resists. By measuring that resistance, the device calculates body composition with a level of specificity that no scale can provide.
At my clinic, I use a medical-grade bioimpedance device that measures:
Body fat percentage — the proportion of total mass that is fat tissue, tracked against age-appropriate reference ranges rather than a single population average.
Lean muscle mass — the actual quantity of skeletal muscle, which we aim to protect (and ideally build) throughout perimenopause. This is the metric that tells us whether a protein and resistance training protocol is working.
Visceral fat rating — a direct measure of the fat stored around internal organs. This is the number with the clearest clinical implications, and it is the one most absent from standard health assessments.
Body water percentage — total body hydration. Relevant to energy, cognitive function, and kidney health, and useful for interpreting other fluctuations in the data.
Metabolic age — an estimate of metabolic health relative to age-matched norms. More a directional indicator than a precise measure, but useful for tracking progress.
If You Are Using GLP-1 Peptides
GLP-1 receptor agonists peptides that support appetite regulation, blood sugar management, and metabolic function have become a significant tool in perimenopause care, particularly for patients with significant insulin resistance or where diet and lifestyle interventions alone are not producing the necessary metabolic shift.
They work. But they carry a specific risk that is not apparent on the scale: lean muscle loss.
Research consistently shows that a meaningful proportion of total weight lost during GLP-1 therapy is lean muscle mass not fat. Without adequate protein intake (typically 1.6–2.2g/kg of body weight daily) and consistent resistance training, patients lose muscle alongside fat. The scale shows a satisfying downward trend. Body composition analysis shows a different picture one that has long-term metabolic consequences, because muscle mass is a primary determinant of metabolic rate, insulin sensitivity, and functional capacity as we age.
If you are using GLP-1 peptides, body composition monitoring is not optional. It is the data that tells us whether the intervention is achieving what we actually want fat loss with preserved or improved muscle mass or whether we need to adjust protein, training load, or the protocol itself.
What We Monitor at the Clinic and Why
A body composition assessment at the clinic establishes a baseline and is repeated at intervals to track the trajectory of change. We are looking at:
Visceral fat rating — target below 12 on our device's scale. This is the clearest single indicator of metabolic risk, and the one I watch most closely.
Body fat percentage — tracked against age-appropriate ranges. Not the same target for a 45-year-old and a 30-year-old, and the reference range accounts for this.
Lean muscle mass in kilograms — is it holding? Is it increasing? This directly informs protein targets, training recommendations, and supplement choices (creatine, for example, has a strong evidence base for supporting lean mass during perimenopause).
Body water percentage — is there chronic dehydration at play? Or is fluid retention masking other changes?
These four metrics, tracked over time, give a picture of whether the changes we are making to diet, to supplements, to movement, to stress management are actually shifting the body in the right direction at the composition level. Not just at the weight level.
What This Means for You
If you have been staring at the number on your bathroom scale and feeling frustrated that it will not move or that it keeps moving in the wrong direction despite doing everything right, I want to offer a reframe.
The number is not the signal. The number is a poor-resolution summary of something far more complex, taken out of context, with no ability to distinguish what is actually changing inside your body.
In perimenopause especially, the question is not "how much do I weigh?" The question is "what is my body composed of, where is the fat sitting, how is my metabolism functioning, and what does the trajectory look like over time?"
Those are the questions bioimpedance answers.
This article is for educational purposes. Please discuss any health concerns with your healthcare practitioner.